
[ad_1]
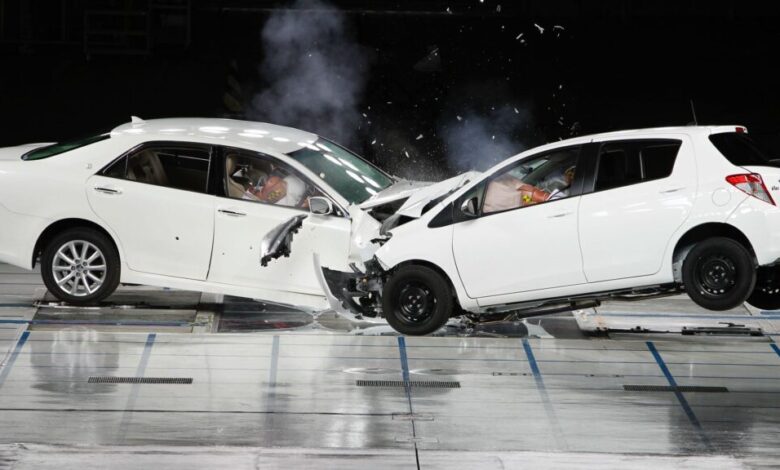
According to new Mitchell research, battery EVs are less likely to incur expensive front-end damage in an accident than petrol-powered vehicles. According to the ‘Q3 2024 Plugged-In: EV Collision Insights’ report, collisions involving front-end impact are the most common and 40 per cent costlier, on average, than those involving rear-end impact.
Based on Mitchell data, ICE vehicles have a higher frequency of front-end impact (31.59 per cent) versus BEVs (25.88 per cent), which are more likely to sustain rear-end damage (35.98 per cent) than ICE alternatives (27.57 per cent).
“There’s a direct correlation between the primary point of impact and claims severity,” said Ryan Mandell, Director of Claims Performance at Mitchell. “Even though overall severity remains higher for BEVs than for ICE vehicles, understanding these point-of-impact dynamics can help auto insurers better assess risk, manage claims and assist policy holders.”
Other key report findings include:
- Claims frequency and severity: Claims frequency for repairable collision-damaged BEVs rose to 3.01 per cent in the US and 3.97 per cent in Canada last quarter, an increase of 47 per cent and 26 per cent respectively year over year. Average claims severity in the US was US$5,560 for BEVs, US$5,229 for plug-in hybrids, US$4,426 for mild hybrids and US$4,741 for ICE vehicles. In Canada, it was US$6,923 for BEVs, US$6,171 for plug-in hybrids, US$6,366 for mild hybrids and US$5,615 for ICE vehicles.
- Total loss market value and frequency: As price parity increases between BEVs and ICE vehicles, it is creating similarities in total loss outcomes. The average total loss market value for BEVs was US$32,718 in the US and US$41,380 in Canada. For 2021 and newer ICE vehicles – which are comparable to BEVs in their complexity and cost to repair – it was US$31,070 in the US and US$42,498 in Canada. Total loss frequency was also nearly identical between vehicle types with BEVs totalling at a rate of 9.9 per cent in the US and 10.11 per cent in Canada, while newer ICE vehicles totalled at a rate of 9.98 per cent in the US and 11.74 per cent in Canada.
- Keys-to-keys cycle time: The US keys-to-keys cycle time average year to date is 19.5 days for BEVs versus 16.5 days for ICE alternatives, an 18 per cent difference. In Canada, average cycle time is 20 per cent longer for BEVs (17.2 days) compared to petrol-powered vehicles (14.3 days). Average cycle time for mild and plug-in hybrids also exceeds that of ICE vehicles in both countries.